Information Design
BACKGROUND
The following were created in Doug Scott's Information Design Class at Northeastern University during the Spring 2020 semester.
SKILLS & TOOLS
Illustration, Graphic Design
Adobe Illustrator, Adobe InDesign
TIMELINE
January - March 2020
3 Trips
For the first project, we were asked to depict three trips with pieces of information about the trips throughout. My trips all begin from my apartment in Boston and show me navigating to Northeastern's campus, my hometown, and to a foreign destination - Paris.
The challenge here was to condense a large amount of information into one understandable infographic describing three separate trips. The data represented here includes: method of travel, activities throughout the trip, how I spent my time throughout each of the trips, weather at each location, trip distance, location coordinates, airports, roads and freeways, and significant geographical landmarks.
Process
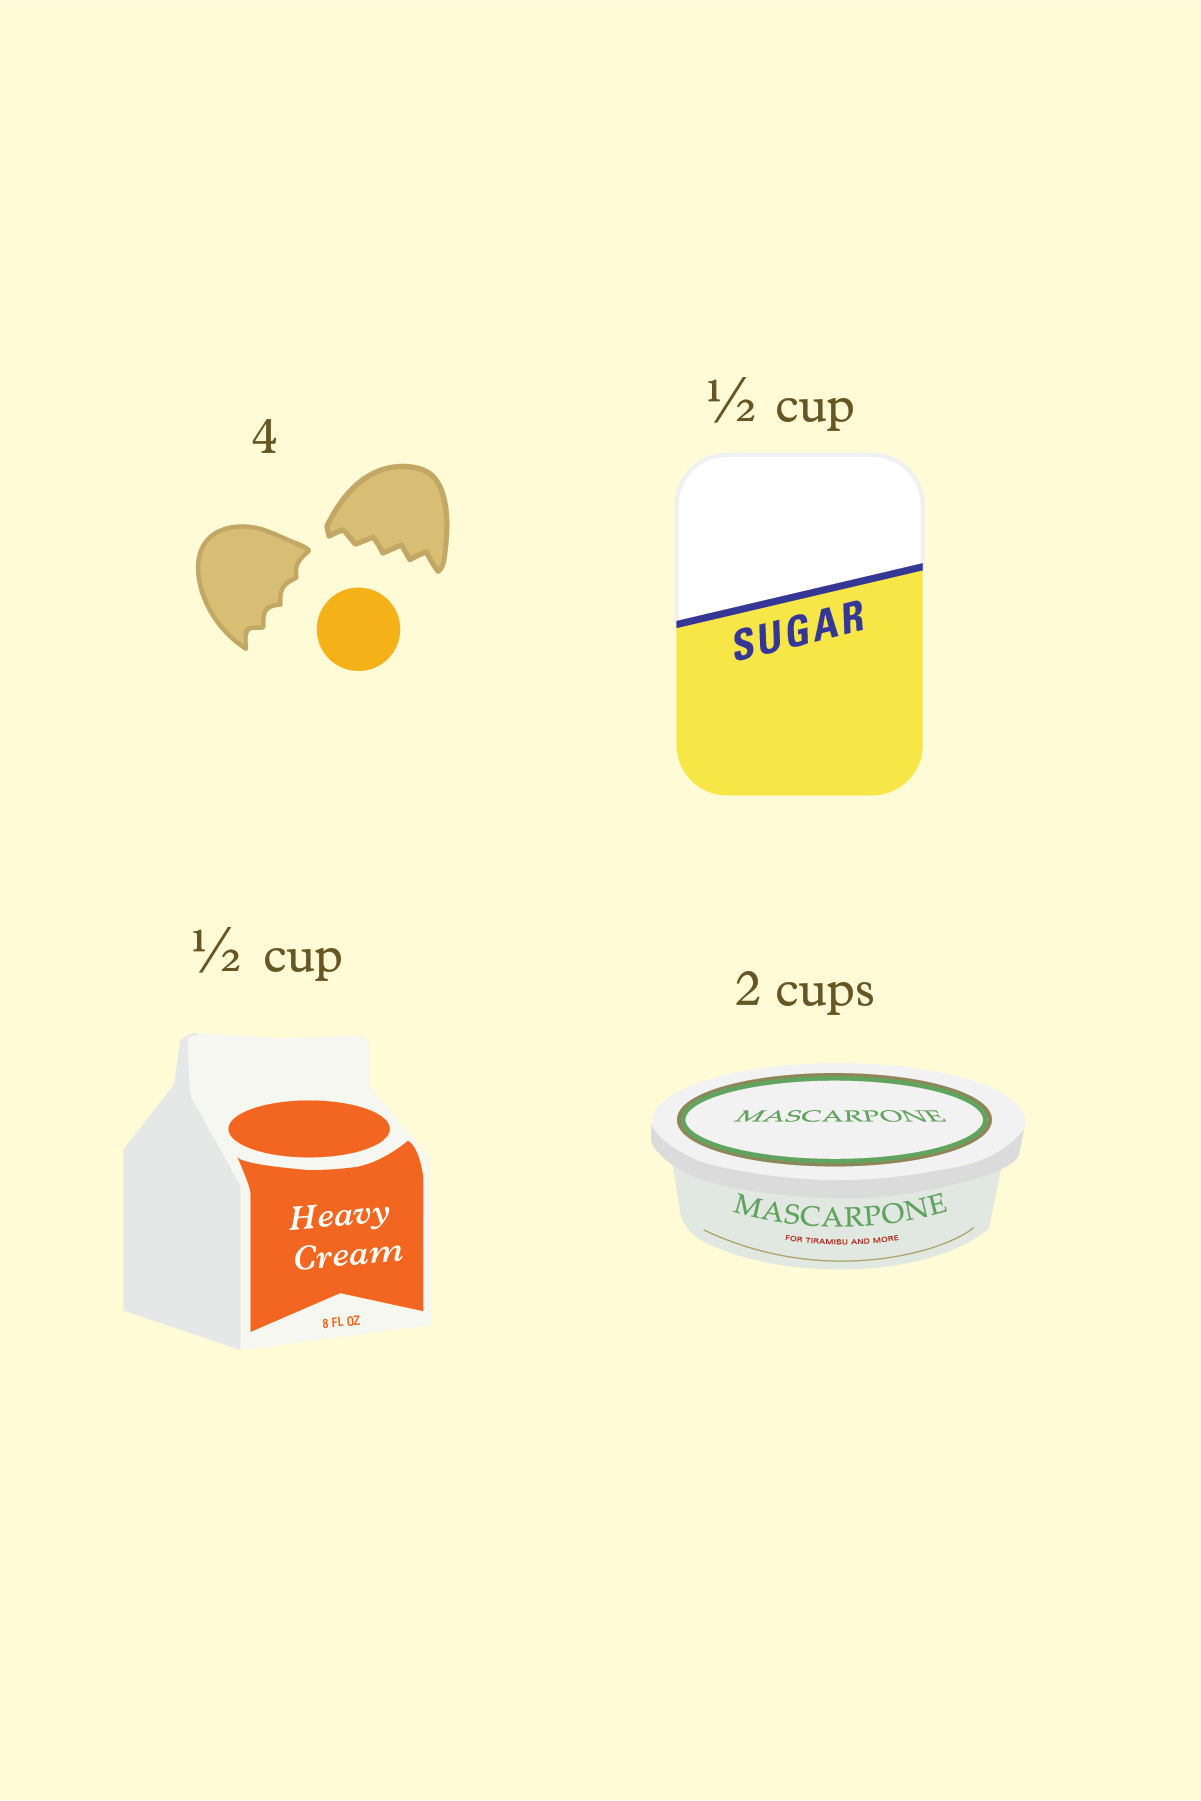
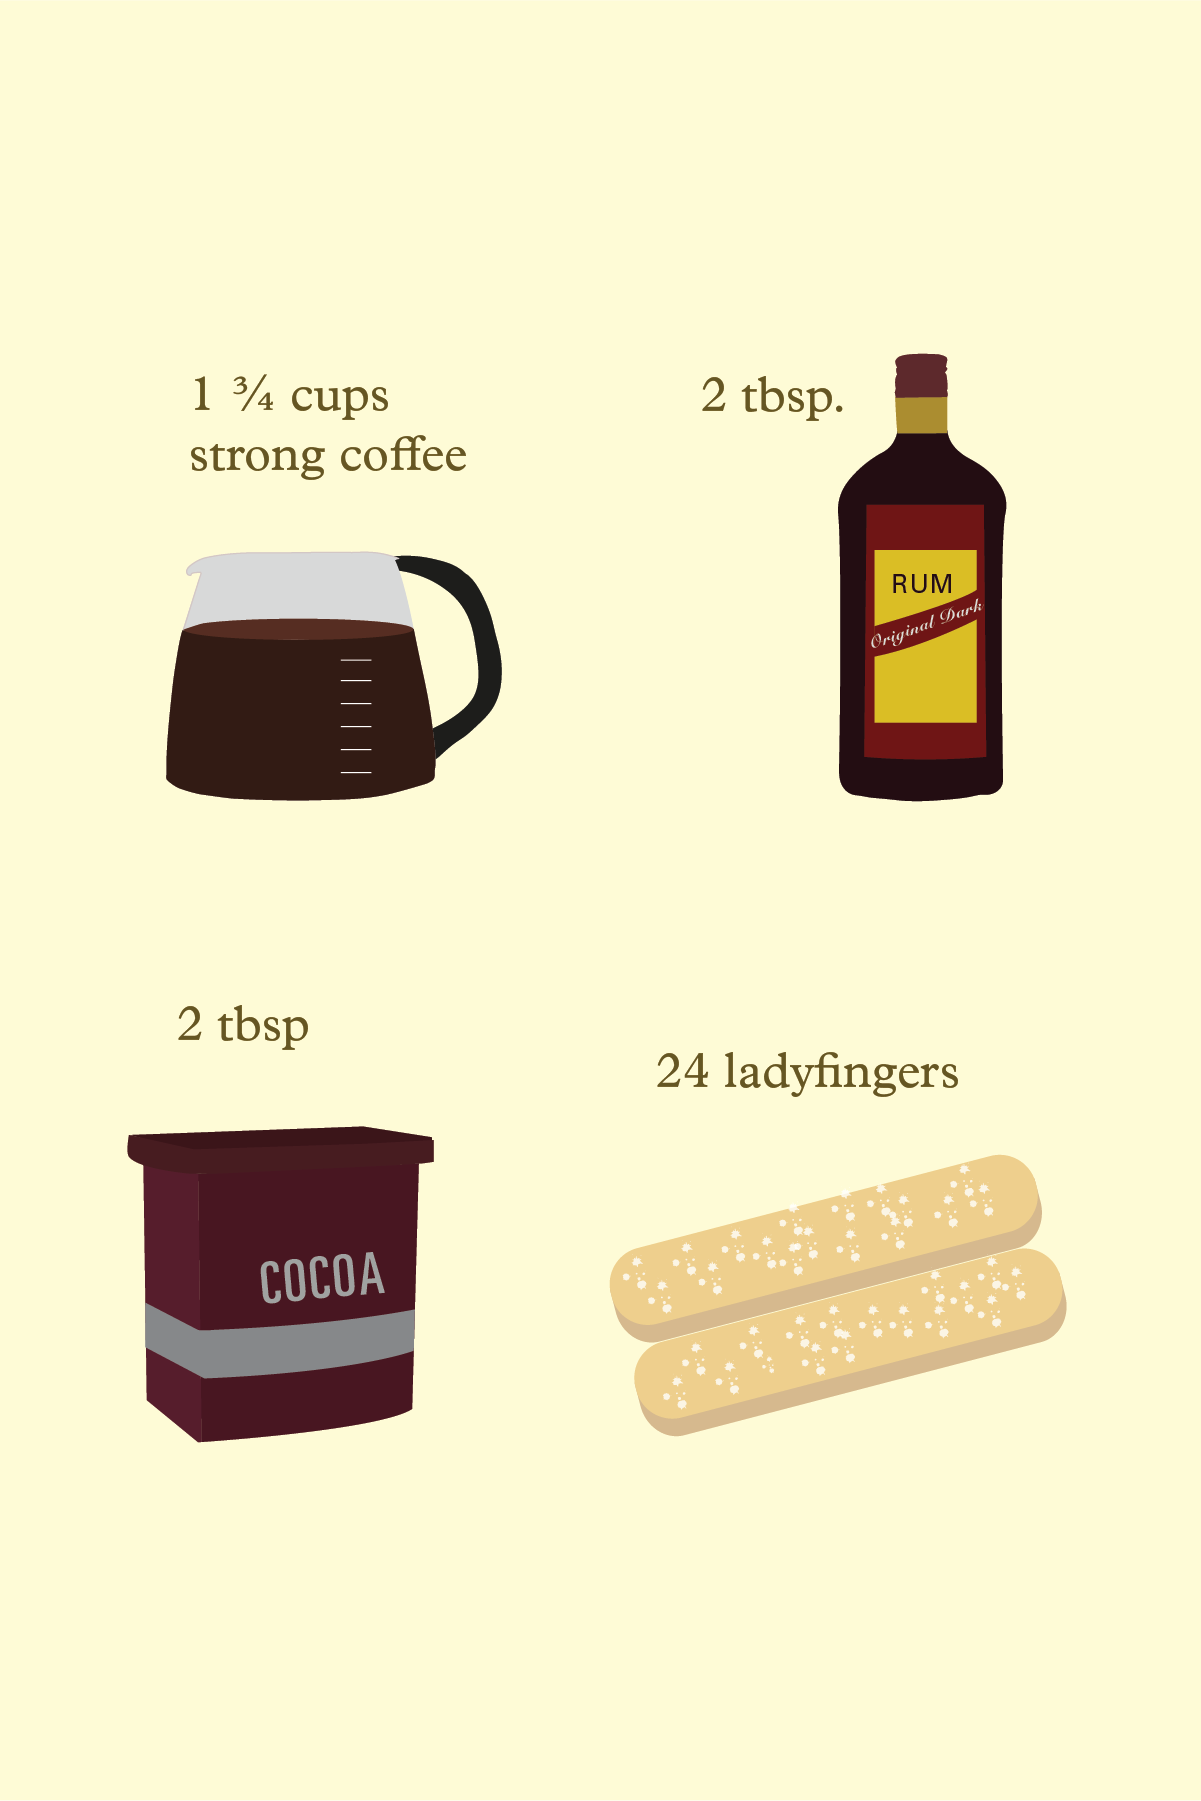
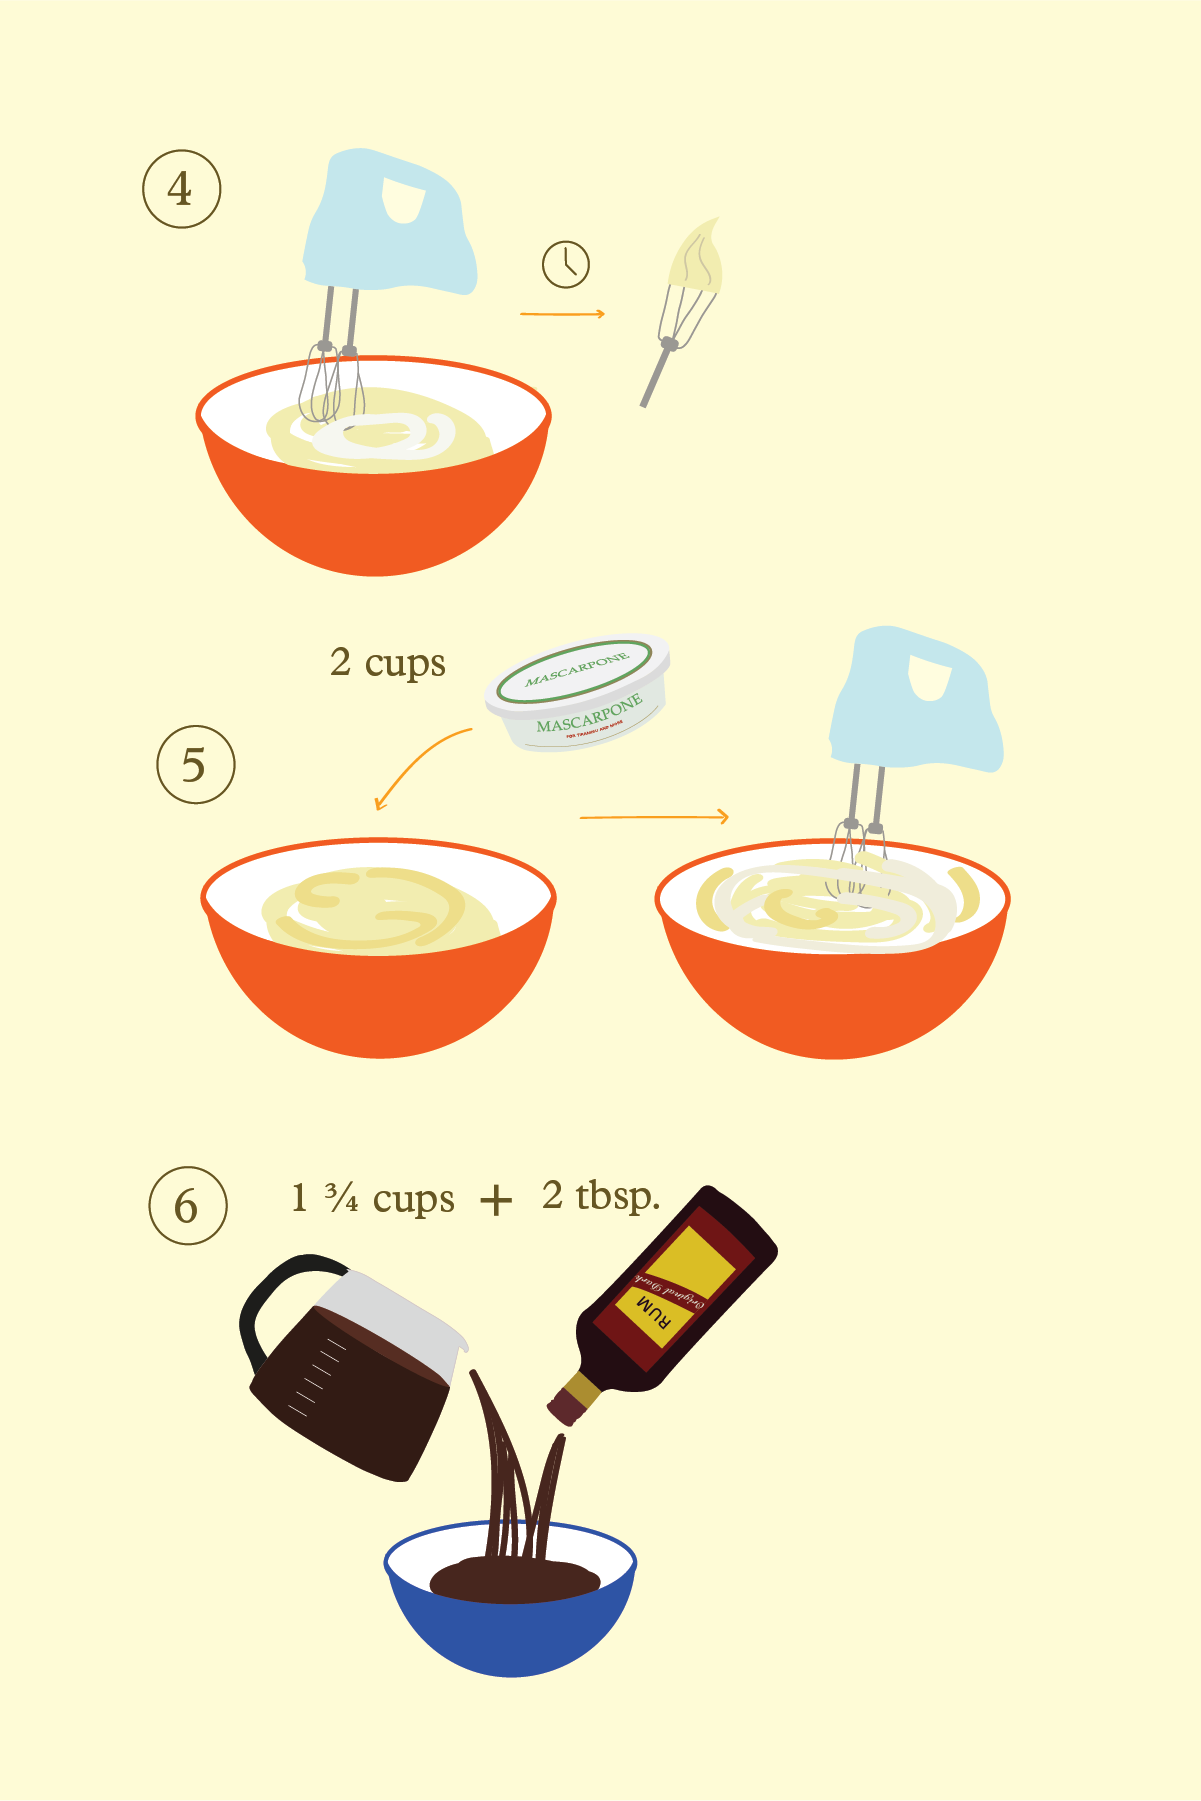
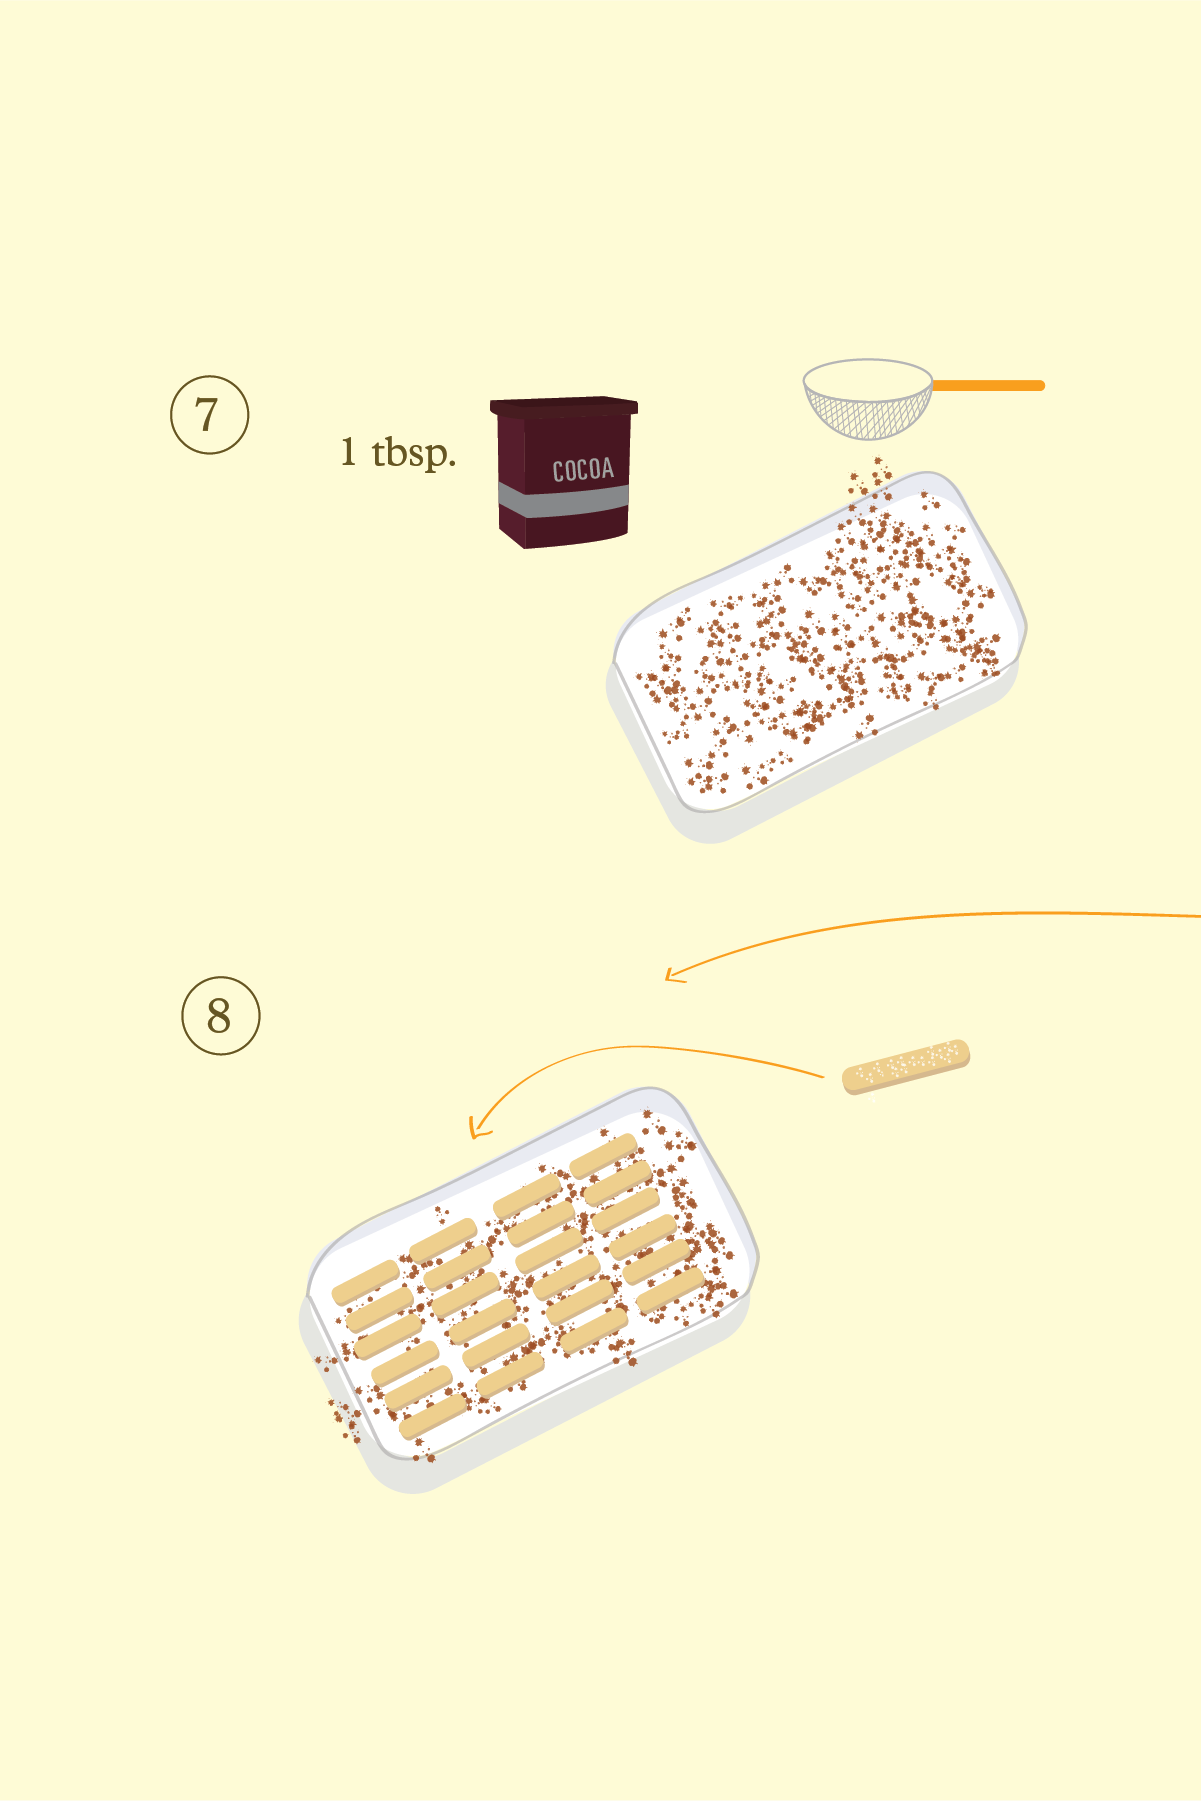
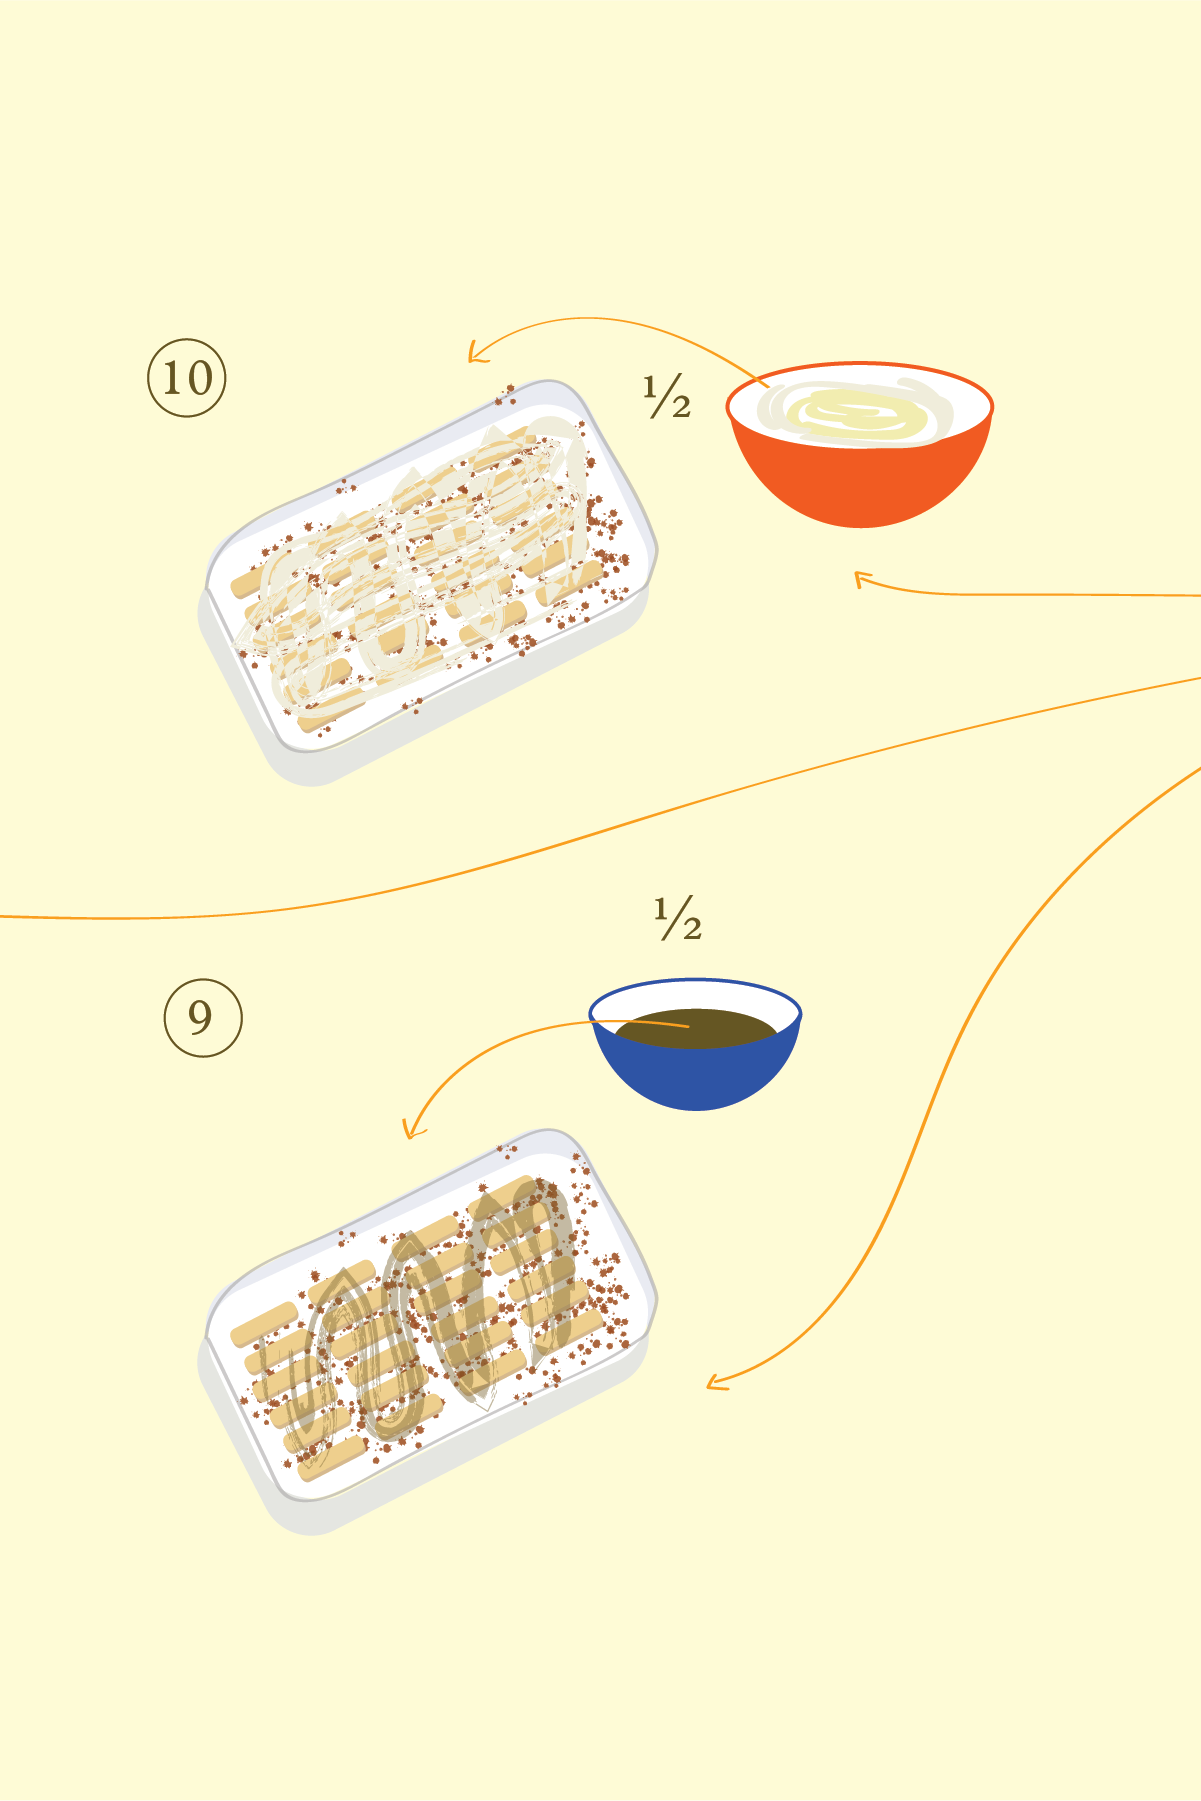
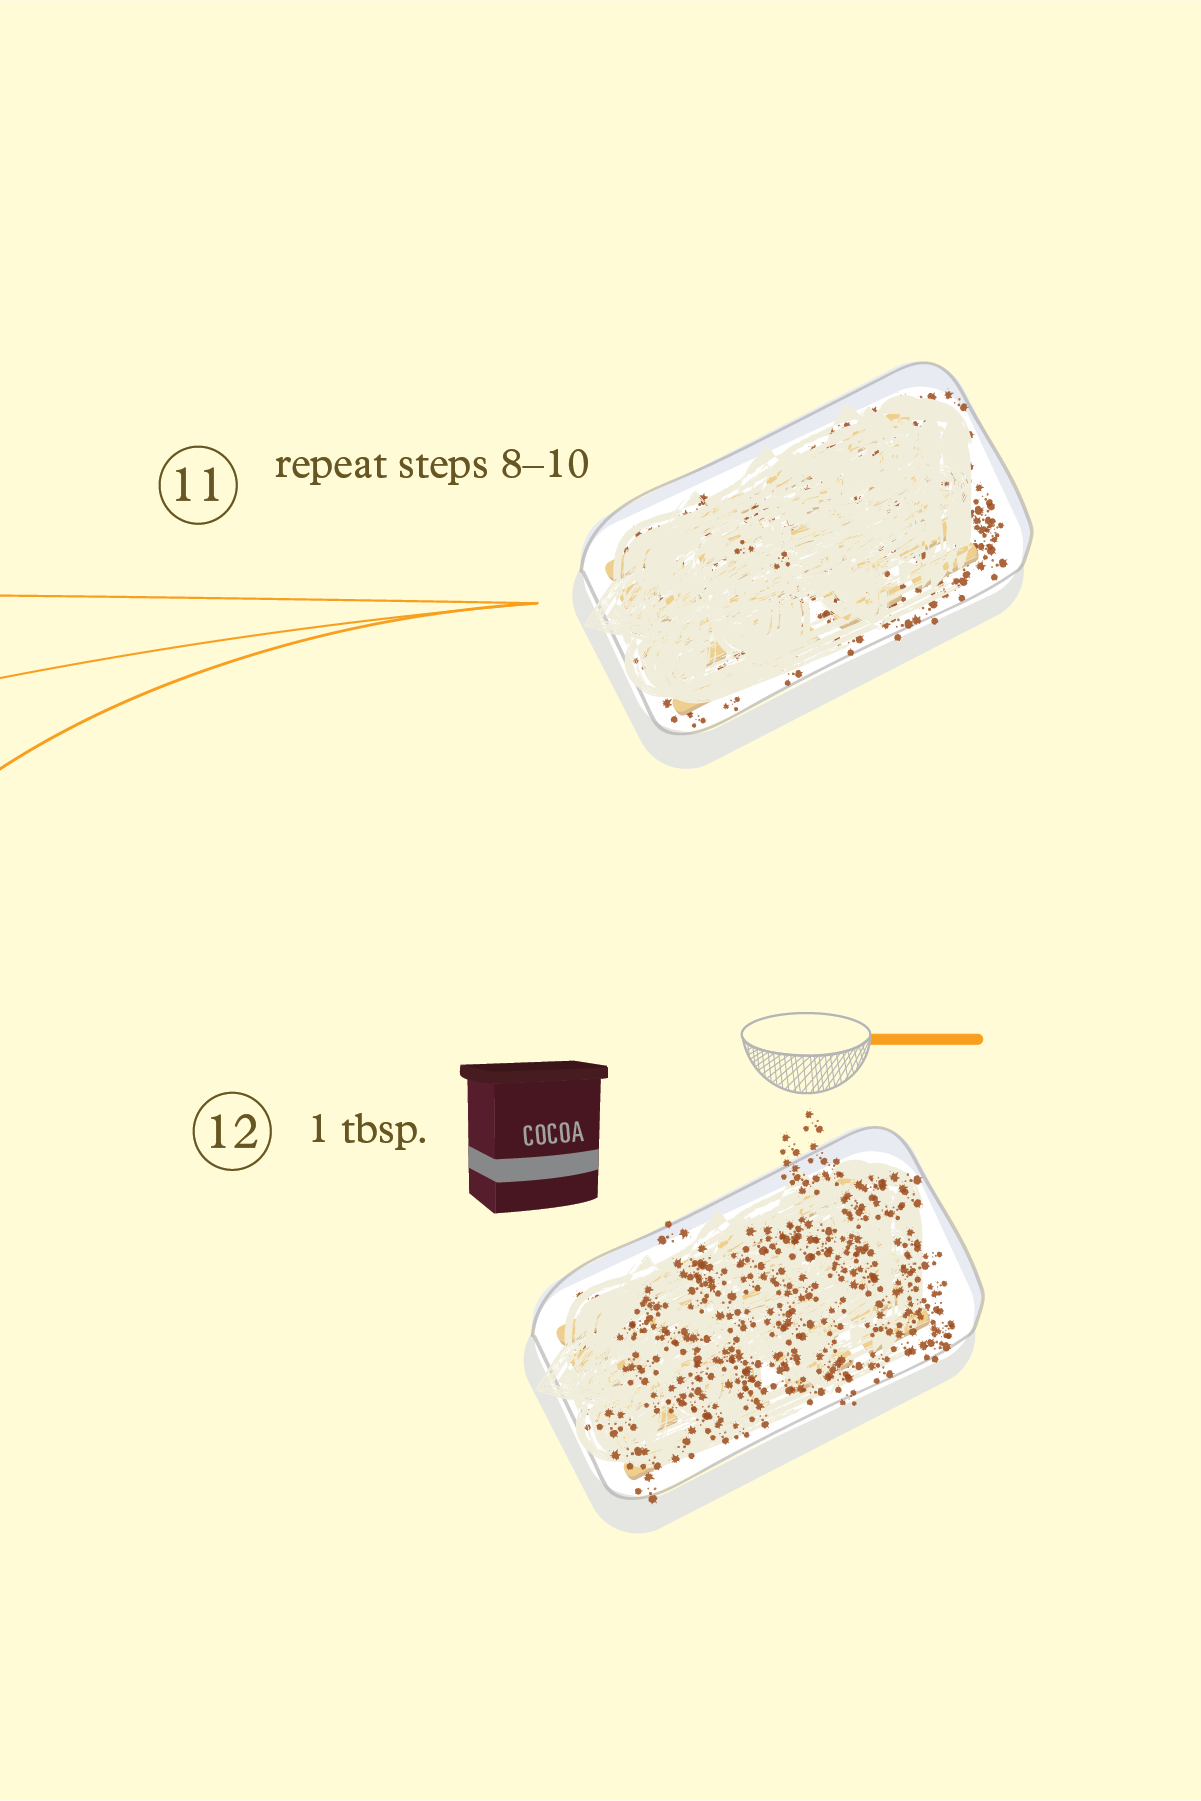
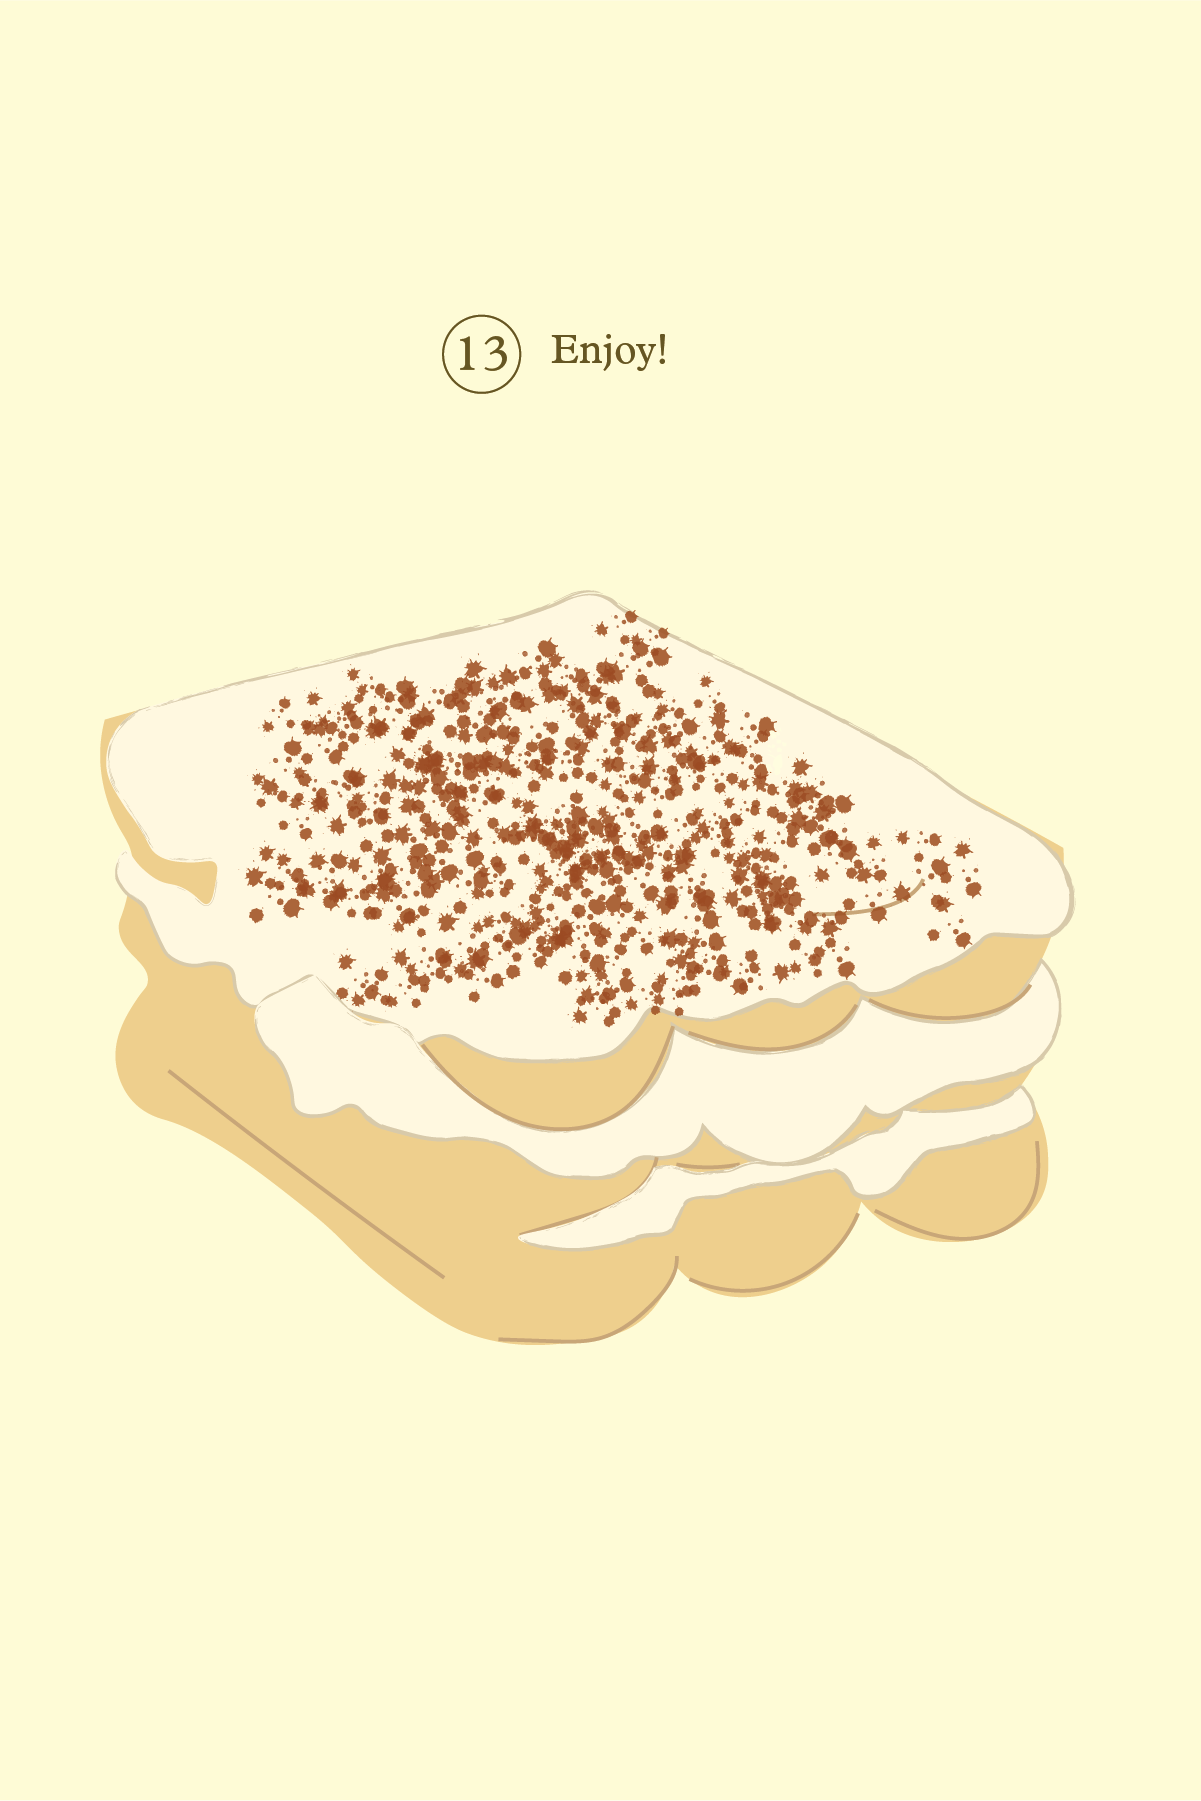
The second project challenge was to illustrate a complex process using limited text. I immediately thought of one of my desserts, tiramisu, and decided to illustrate its recipe.
This was designed as a nine-panel, 4" x 6" folding accordion.

Country Data
This final project was to condense over 30 pieces of data about Bangladesh into one infographic poster. The challenge of the project was to create independent yet cohesive data visualizations, and compile them into a digestible and organized poster.
This was designed as a 26" x 36" poster.